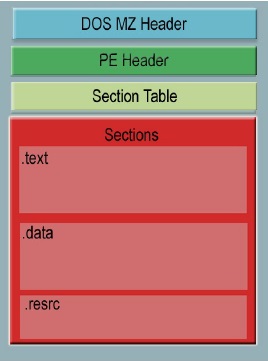
A win32 portable executable(PE) file consists of: DOS Header, PE Header, Section Table, Sections. Analyzing a PE file gives us a lot of information like the address in memory where the file will be located (ImageBase), address of entry point, imported and exported functions, packed or unpacked etc. Thus this static analysis can indicate whether it’s a malware or not etc.
PE File Architecture
DOS MZ header is 64 bytes in size. Its structure, IMAGE_DOS_HEADER, is defined in winnt.h. The important fields present in this are:
e_magic-> contains the value 4Dh, 5Ah (or letters “MZ” for Mark Zbikowsky who designed the MS-DOS);
e_lfanew-> contains the offset of the PE header.
The PE header structure IMAGE_NT_HEADERS contains 3 fields: Signature, FileHeader and OptionalHeader.
Signature is a DWORD(4 bytes) containing the value 50h, 45h, 00h, 00h (“PE” followed by two terminating zeroes).
FileHeader (IMAGE_FILE_HEADER) is the next 20 bytes of the PE file and contains info about the physical layout & properties of the file e.g. number of sections.
OptionalHeader (IMAGE_OPTIONAL_HEADERS) is always present and forms the next 224 bytes. It contains info about the logical layout inside the PE file with fields like AddressOfEntryPoint, ImageBase, FileAlignment, SectionAlignment etc. The last 128 bytes contains the Data Directory which is an array of 16 IMAGE_DATA_DIRECTORY structures.
The Section Table contains information about each section present in the pefile. Some of the sections are:
Code section: .text contains the executable instructions
Data Section: .bss –>uninitialized variables; .rdata->read only variables; .data->initialized variables
Export data: .edata->names and addresses of exported functions as well as Export Directory
Import data: .idata-> names and variables of imported functions as well as Import Descriptor and IAT.
Swiss Army knife tools
Some of the important and useful tools you may need to explore more details are: PEid, PEview, PE Explorer, PE browse, dependency walker, Resource hacker, Lord PE and Import Reconstructor.
 (PE Viewer to view internal details in organized format)
Though lots of GUI tools are available for studying a pe-file, you can program your own custom tool in python using the “pefile” module. Let’s study the usage of this module.
To open an executable using pefile:
| >>> pe=pefile.PE(‘hello.exe’)
>>> pe <pefile.PE instance at 0x0000000002B06248> |
We can search for individual fields like:
| >>> pe.OPTIONAL_HEADER.AddressOfEntryPoint
4096 >>> pe.OPTIONAL_HEADER.ImageBase 4194304 >>> pe.FILE_HEADER.NumberOfSections 3 |
Let’s check each section in detail:
| >>> for section in pe.sections:
print (section.Name, hex(section.VirtualAddress), hex(section.Misc_VirtualSize), section.SizeOfRawData ) (‘.text\x00\x00\x00’, ‘0x1000’, ‘0x26’, 512) |
To dump all the fields of the file, just a single simple command:
| >>> print pe.dump_info() ———-DOS_HEADER———- [IMAGE_DOS_HEADER] ———-NT_HEADERS———- [IMAGE_NT_HEADERS] ———-FILE_HEADER———- [IMAGE_FILE_HEADER] Flags: IMAGE_FILE_LOCAL_SYMS_STRIPPED, IMAGE_FILE_32BIT_MACHINE, IMAGE_FILE_EXECUTABLE_IMAGE, IMAGE_FILE_LINE_NUMS_STRIPPED, IMAGE_FILE_RELOCS_STRIPPED
———-OPTIONAL_HEADER———- [IMAGE_OPTIONAL_HEADER] DllCharacteristics: ———-PE Sections———- [IMAGE_SECTION_HEADER] Flags: IMAGE_SCN_CNT_CODE, IMAGE_SCN_MEM_EXECUTE, IMAGE_SCN_MEM_READ Entropy: 0.378734 (Min=0.0, Max=8.0) [IMAGE_SECTION_HEADER] Flags: IMAGE_SCN_CNT_INITIALIZED_DATA, IMAGE_SCN_MEM_READ [IMAGE_SECTION_HEADER] Flags: IMAGE_SCN_MEM_WRITE, IMAGE_SCN_CNT_INITIALIZED_DATA, IMAGE_SCN_MEM_READ Entropy: 0.231158 (Min=0.0, Max=8.0)
———-Directories———- [IMAGE_DIRECTORY_ENTRY_EXPORT] [IMAGE_DIRECTORY_ENTRY_IMPORT] [IMAGE_DIRECTORY_ENTRY_RESOURCE] [IMAGE_DIRECTORY_ENTRY_EXCEPTION] [IMAGE_DIRECTORY_ENTRY_SECURITY] [IMAGE_DIRECTORY_ENTRY_BASERELOC] [IMAGE_DIRECTORY_ENTRY_DEBUG] [IMAGE_DIRECTORY_ENTRY_COPYRIGHT] [IMAGE_DIRECTORY_ENTRY_GLOBALPTR] [IMAGE_DIRECTORY_ENTRY_TLS] [IMAGE_DIRECTORY_ENTRY_LOAD_CONFIG] [IMAGE_DIRECTORY_ENTRY_BOUND_IMPORT] [IMAGE_DIRECTORY_ENTRY_IAT] [IMAGE_DIRECTORY_ENTRY_DELAY_IMPORT] [IMAGE_DIRECTORY_ENTRY_COM_DESCRIPTOR] [IMAGE_DIRECTORY_ENTRY_RESERVED]
———-Imported symbols———- [IMAGE_IMPORT_DESCRIPTOR] kernel32.dll.ExitProcess Hint[155]
[IMAGE_IMPORT_DESCRIPTOR] user32.dll.MessageBoxA Hint[433]
|
Sometimes while manually unpacking a packed file, we need to change the Address of Entry Point to OEP.
| >>> pe.OPTIONAL_HEADER.AddressOfEntryPoint = 5000
>>> pe.write(filename=” hello1.exe”) |
Packed PE files
A file is packed mainly for 3 purposes:
• To hide the behaviour of the malware from AV
• To reduce the size of the exe
• To prevent crackers from cracking the serial key of the software.
PEiD is the best tool available to find whether the executable is packed or not. It can detect signatures of almost all packers available.
(A deep scan in PEiD shows that UPX packer was used to pack explorer.exe)
Though packing an executable makes it difficult to perform static analysis of a malware, dynamic analysis has no effects because the file ultimately has to be unpacked before executing. Hence, it can only be used to fool a novice user!
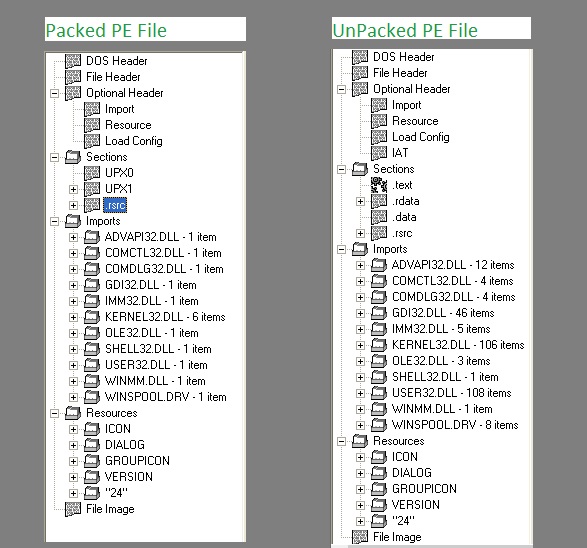
Above diagram shows comparison of packed and unpacked “putty.exe” files through PE Browse. Packing a file with UPX will compress the various sections present, because these consume the maximum size. Compressed sections are renamed as UPX0, UPX1 and so on. We also see that many imported functions from the various DLLs are missing.
The execution of a packed exe starts with the new Address of Entry point. Initially, the register status is saved using PUSHAD instruction. Then unpacking of the packed sections is done followed by resolving the import table of the original exe. Restore the original register status using POPAD instruction and finally jump to the OEP.
Once we understand how a packed exe works, it is easy to unpack it manually. Following steps can be followed while unpacking using OllyDbg as mentioned in one of the trainings by SecurityXploded:
- Start tracing until you encounter a PUSHAD instruction(generally its the 1st or 2nd instruction).
- Put a hardware breakpoint at address stored by ESP in the immediate next instruction.
- Press F9 to continue execution. Execution stops at the breakpoint address.
- Continue tracing until you encounter a JMP instruction which will jump to OEP.
- At OEP, dump the whole program using Ollydump plugin
- Fix Address of Entry point of the new executable and resolve the imports using Import Reconstructor (ImpRec).
References:
1] Bin Portable Executable File Format-A Reverse Engineer View
2] Manual Unpacking of UPX using OllyDbg


No Comments Yet